The plot
Use the AAUIMUKIT to collect data from an experiment.
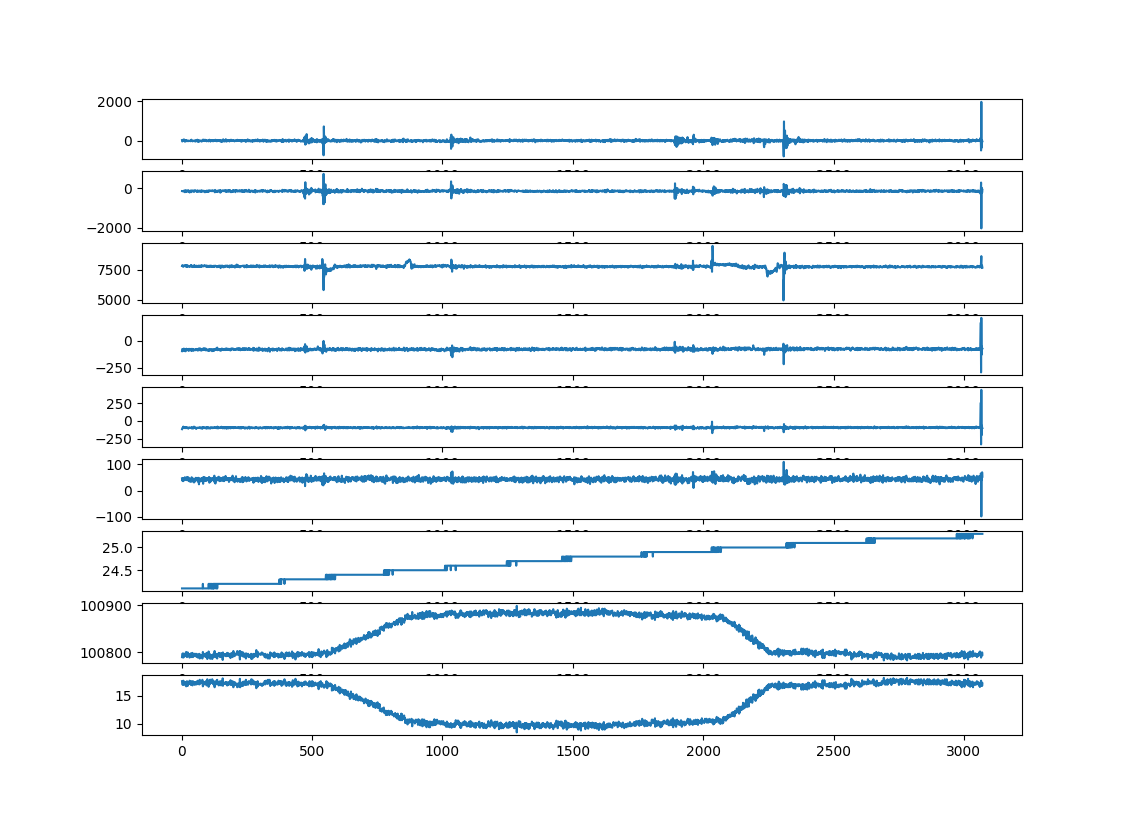
a trip in the lift from top floor to cellar
Convert data to engineering units
See if you can estimate the altitude between top and botom of journey
Maybe apply filtering
more on this later l
Try to use accelerometers and pressure sensors to altitude determination.
A std shield based on an Uno.
Data from experiment (LOG00082.TXT)
The Arduino code src/sketchbook/mpu606xbmp285rob3no3/mpu606xbmp285rob3no3.ino
A precollected data set is available
src/data/shield1/LOG00082raw.TXT
3071 samples
40 msec aka 25 Hz sampling rate
src/data/shield1/LOG00082.TXT w comments in top
A plot of raw values - hmm bottom plot is altitude calculated from airpressure
 |
view large plotall.png
python plotting code: plotallraw.py.txt
See more at https://jensd.dk/doc/sensors/gy80gy87gy88gy91/
AAUIMUSHIELD shield code i2scanner3, data, plots etc look for it below
code, library files data from experiment images etc at …
Src folder list: here
The code for an experiment
The Arduino code does…
sampling every 40 msec (25 hz)
100 samples equal 4 seconds sampling
sample and save 3 axis acceleration
config to +/- 4G (equals -32768 - 32767 in raw format - int16 range)
sample and save 3 axis gyro
confit to +/- 500 degr/sec (equals -32768 - 32767 in raw format - int16 range)
air pres (equals -32768 - 32767 in raw format)sure
air pressure converted to altitude
air temperature
The code src/sketchbook/mpu606xbmp285rob3no3/mpu606xbmp285rob3no3.ino
The has been tested and one sample takes less than 25 msec with a margin
So …
It has been choosen to go for 40 msec just 2Bsafe
Libraries
You need to have two libraries installed
mpu606x.zip zipfile for arduino install
bmp085 zipfile for arduino install
See src/index.html
the experiment eop
Jens
As long as you retain this notice you can do whatever you want with this stuff on these pages.
If we meet some day, and you think this stuff is worth it, you can buy me a beer in return :-)
(C) Jens Dalsgaard Nielsen
credit for license this goes to phk@FreeBSD.ORG
