The experiment - Results
The experiment took place in the lift between FRB7C C1 and C2.
From top to bottom: from first floor to the cellar.
All data, code and plot used here can be found in data/shield1 in …
See src/index.html
The raw data
3071 lines sampled with 25 Hz (40 msec)
The raw files are
src/data/shield1/LOG00082raw.TXT with trailing text removed
The data visualised
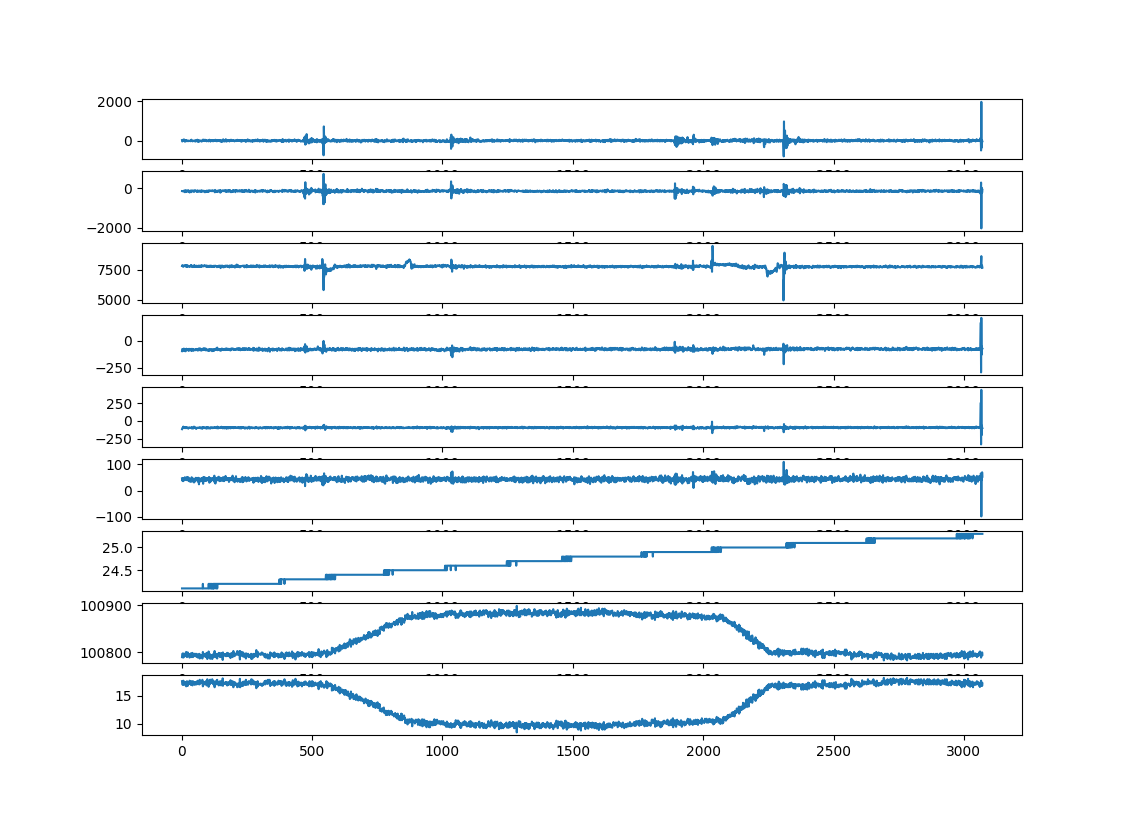 |
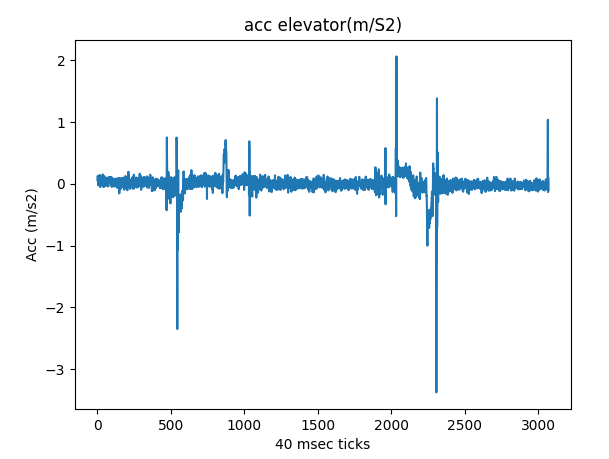
Acceleration
 |
By inspection the lower plot( axis z) shows start of lift going down at 500+ (500*40msec after start).
Stop in cellar is approx 800.
Going up starts at 2000+ and arrival at 2250 approx
x and y axis shows only a short shaken at start/stop.
This is in accordance because z axis is point up from the shield.
SO from here we only look at acceleration in z axis.
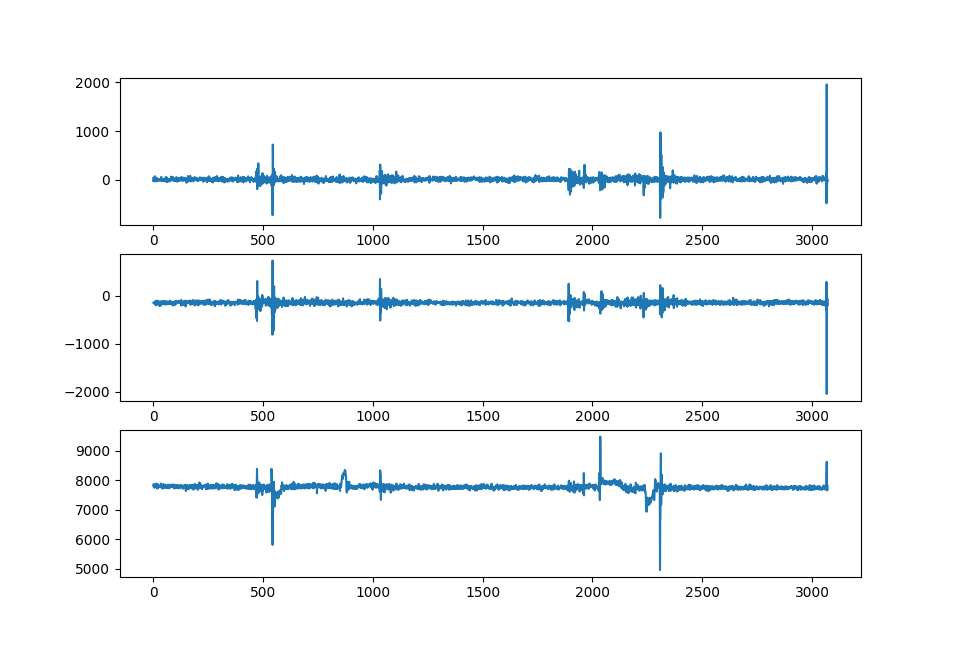
Acceleration
Acceleration (in Z axis) is found in
-
raw numbers 4G is 32767 and -4G is -32768
src/data/shield1/082acczG.txt is the raw numbers scaled with 4.0*9.82*(val/32768)
NB Dont forget to compensate later bq G = 9.82 m/s2
The raw data
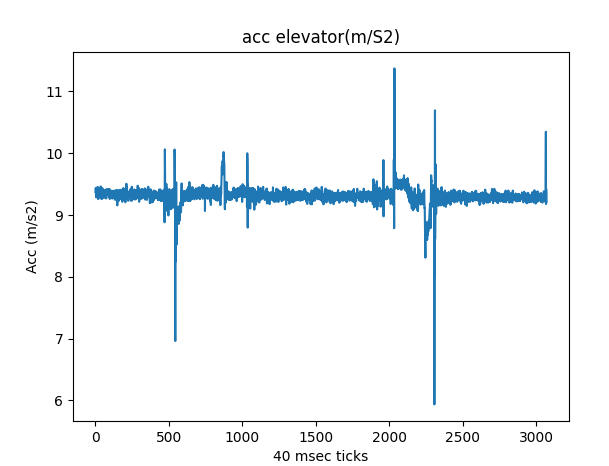 |
It can be seen by the nakes eye that there is an offset which we will find and compensate for.
 |
We will calculate mean from 800 to 1100: which give 9.3090
Subtracting this from our raw acc z data we get
 |
The trip down
It task rougly 12 seconds inclusive acceleratino to take the lift 2 floors down
We will adjust it to 11 second.
This is one of the figures which er not so precise
Sampling with 40 msec we have 25 samples/second.
12 seconds equal 300 samples
11 seconds 275 samples
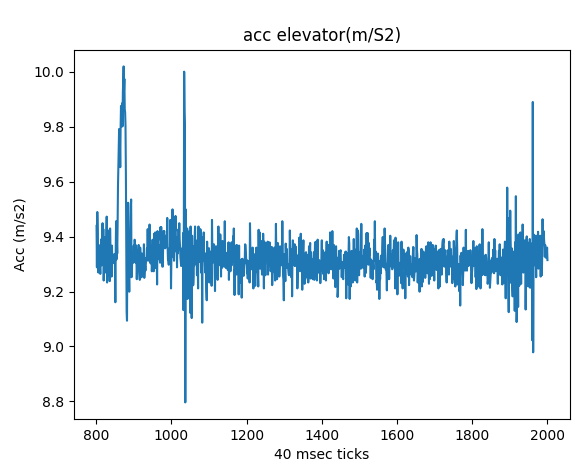
Looking at
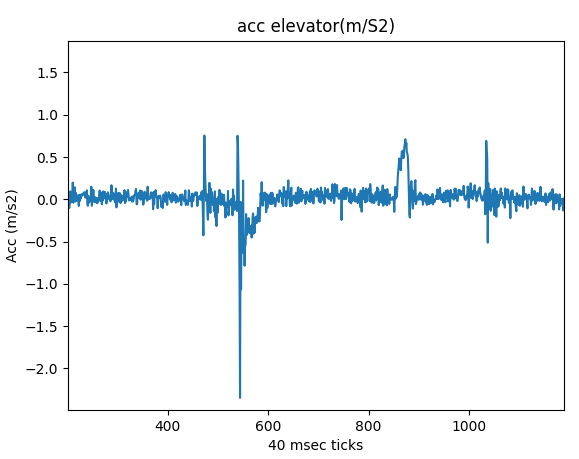 |
we magnify
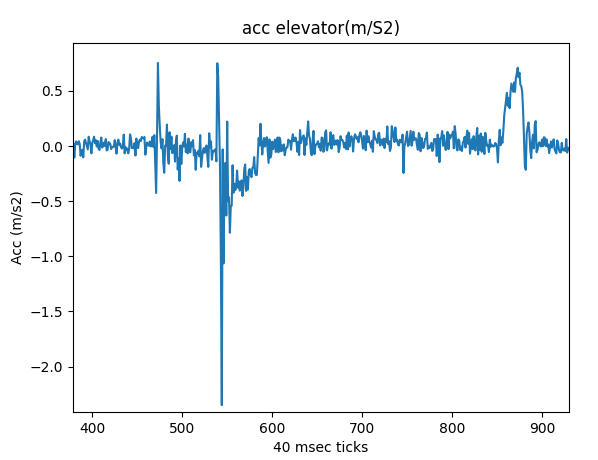 |
Obervations and results
Lift start at approx sample 541
Acceleration stop approx sample 580: 40 samples acceleration - 1 long second
Decelleration starts at approx 852
Travel time around 300 samples or 12 seconds
Summing up acceleration by multiply acc with 40 msec we can estimate velocity after acceleration
sample 541 to 580 final velocity 0.63 m/s
sample 541 to 600 final velocity 0.66 m/s
sample 541 to 620 final velocity 0.65 m/s
adjusting acceleration
We did measure med acceleration to 9.3090 msec2 and gravity is 9.82 ms2.
So we must adjust the acceleration by a factor 1.055
This gives a velocity at 0.65*1.055 msec2 = 0.69 ms
12 sec lift time give a distance around 8.28 m
11 sec lift time give a distance around 7.59 m
Closer inspection
So velocity estimate is around 0.65m/sec
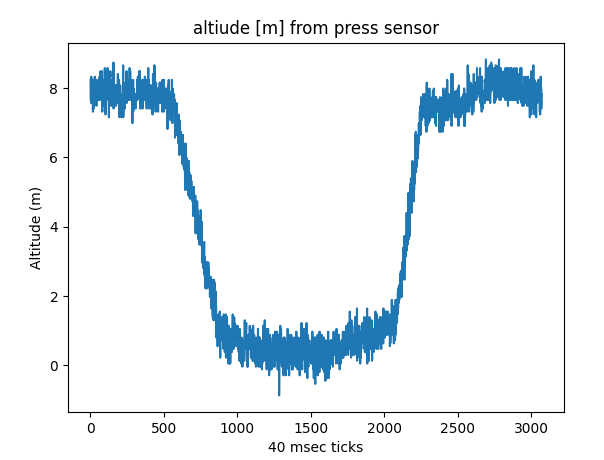
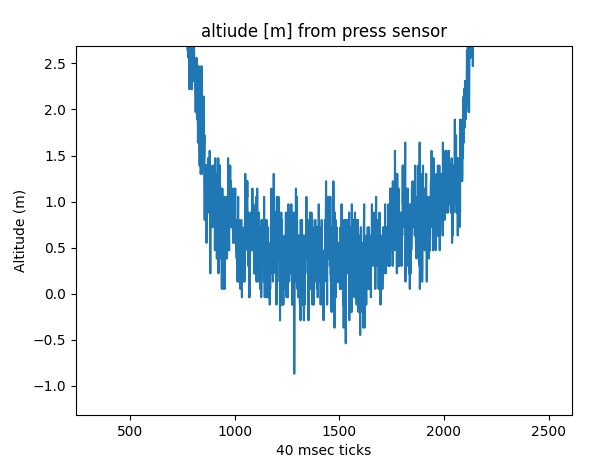
Airpressure
Air pressure in Pascal
src/data/shield1/082airpascal.txt
Converted to altitude with Pressure reference at sealevel 101000.0
 |
 |
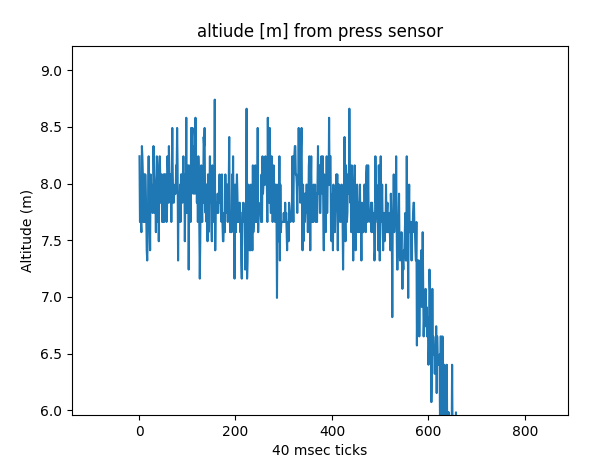 |
Results by inspection
left part high approx 7.9m
center part low approx 0.4m
lift travel is approx 7.5m
Overall result
by acceleration 7.6m or a litle more
by air pressure 7.5m
Still missing stat etc
qed
Jens xxxxxxxxxxxxxxxxxxxx
xxxxxxxxxxxxxxxxxx
Air pressure
1 min no movement equals 25*60 samplings
For each calculate mean and std deviation (the last for observing quality)
Do the same for the logged altitude
calculate vertial travel distance (you should have four measurements - are they equal ?)
Accelerometer
Which acceleration axis has been “active”
As for air find the four sections with no travel and calculate average and std deviation
Plot the for set data of movement - Can you setup a simple for for the acceleration and decceleration part for each travel
After acceleratino(start)c and before dec (stop) what is gravity compared to still stand
How long time goes for acc, <travel>, stop
Can we use the accelleration part to estimate the velocity for the after acceleration settle
If so can you by knowing this and travel time estimate the vertical travel distance
If so do you have same velocity up going a down going (uuuhh my english)
Compare air pressure model with the acc model
as title say
your model
aftermath
Standard air pressure is 1013 hekto pascal
Datasheet for the BMP085
What is the absolute accuracy for the sensor
1 Bar equal 1013 hekto Pascal. which equals approx 10 m watercolumn (vandsøjle)
1 m3 air weight 1.2 kg equal 12 Pascal
What is the absolute and relative accuracy for the bmp085
If 1.2 kg air (1m3) equals 12 Pascal what is thiese unaccuracy in meter
How does this comply to your measurements
The image below shows altitude related tp airpressure. It quite linear up to 2-3 km.
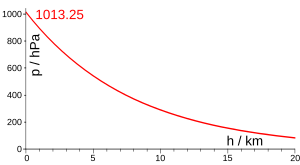 |
credit: wikipedia
Experiment - airpressure
https://pilotinstitute.com/pressure-altitude-explained/
See also (same formula bosch producer of bmp
And the code in the bmp085 library:
float calcAltitude(float pressure,float seaLevel)
{
    float A = (1.0 * pressure)/seaLevel;
    float B = 1.0/5.25588;
    float C = pow(A,B);
    C = 1.0 - C;
    C = C /0.0000225577; // or just 44330.0 /JDN
    return C;
}
which is equal to the bosch code
The accuracy goes down when hen altitude goes up.
Jens
As long as you retain this notice you can do whatever you want with this stuff on these pages.
If we meet some day, and you think this stuff is worth it, you can buy me a beer in return :-)
(C) Jens Dalsgaard Nielsen
credit for license this goes to phk@FreeBSD.ORG
